Un magazine aux couleurs olympiques !
La nouvelle édition du magazine annuel Yellow Tomorrow met les collaborateurs à l’honneur autour des valeurs du sport.
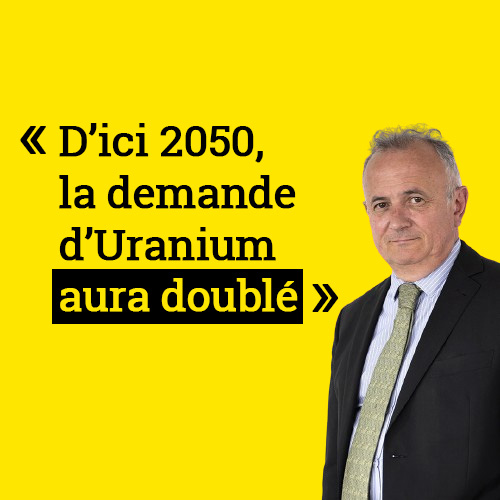
Nos activités minières couvrent l’exploration, la production et la commercialisation d’uranium dans le monde ainsi que le réaménagement des anciens sites miniers.
Voir l'expertiseLa conversion consiste à purifier et transformer le minerai d’uranium. Cette étape est réalisée dans notre usine de conversion Philippe Coste reconnue pour sa modernité.
Voir l'expertisePour être utilisable comme combustible nucléaire, l’uranium naturel doit être enrichi. Cette étape a lieu dans la plus grande usine d’enrichissement d’Europe : Georges Besse II.
Voir l'expertiseGrâce à la performance de ses usines de la Hague et de Melox, Orano est devenu un leader mondial dans le traitement et le recyclage des combustibles nucléaires usés.
Voir l'expertiseOrano a 50 ans d’expérience dans la gestion des déchets radioactifs et le démantèlement d’équipements de sites nucléaires, ou d’installations en fin de vie.
Voir l'expertiseOrano est un fournisseur de référence dans le soutien à l’exploitation des sites nucléaires : logistique de chantier, maintenance spécialisée, sécurité radiologique.
Voir l'expertiseLes activités d’ingénierie concernent les marchés de conseil en ingénierie, assistance à maîtrise d’ouvrage ou maîtrise d’œuvre, ingénierie de conception et de réalisation, démarrage et soutien à l’exploitation des usines.
Voir l'expertiseTout au long du cycle du combustible, Orano apporte son expertise unique dans la conception, l’agrément et la fabrication d’emballages nucléaires, ainsi que la réalisation des transports.
Voir les projetsOrano Med, filiale d’Orano, est une société alliant biotechnologies et nucléaire pour développer de nouvelles thérapies dans la lutte contre le cancer.
Voir l'expertiseDécrypter l’énergie nucléaire pour la rendre plus claire et accessible à tous, pour répondre aux questionnements et idées reçues, c’est l’objectif de « Nucléaire + clair ». A travers ses articles, ses podcasts et ses vidéos, cette rubrique vise à vous éclairer sur les enjeux et les usages du nucléaire.
En agissant pour la souveraineté énergétique, pour la lutte contre le réchauffement climatique avec une énergie bas carbone mais aussi pour l’économie des ressources avec le recyclage des matériaux stratégiques ou encore le déploiement de thérapies contre le cancer, le nucléaire montre qu’il est avant tout une ressource pour le futur. A chacun de se faire sa propre opinion.
L’intelligence collective est un des piliers d’Orano. Elle est au cœur de notre organisation pour établir des relations exigeantes comme l’est notre activité tout en étant bienveillante envers nos salariés. Elle permet à tous de progresser à son poste et de construire un parcours professionnel cohérent dans un large éventail de métiers. Elle favorise la formation et l’acquisition de compétences nouvelles dans une démarche d’excellence.
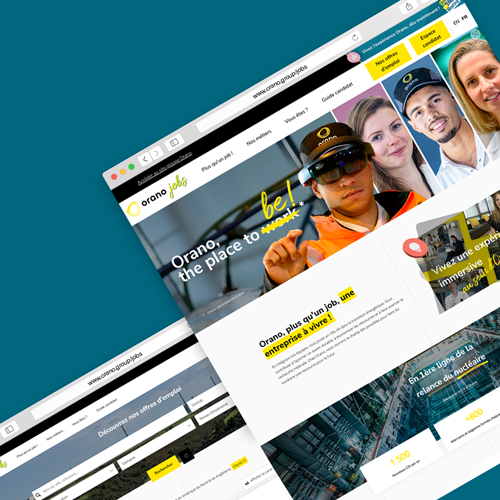
Orano JobsLe besoin en électricité n'a jamais été aussi important dans le monde et, dans le même temps, il est devenu crucial de limiter nos émissions de gaz à effet de serre. Découvrez comment l'énergie nucléaire apporte une réponse à ces enjeux et contribue à agir contre le réchauffement climatique ! Ou vivez l'expérience GO for Climate pour composer le meilleur mix énergétique possible pour satisfaire les besoins en énergie tout en créant un monde bas carbone.
Nucléaire & Climat / GO for Climate